
Remembering the Herbie Visualizer
Herbie is a tool for automatically transforming floating-point formulas to be more accurate, and it's pretty good at this job. And one of Herbie's best features is that it does not require any user input; numerical methods expertise is rare. But while fully automated operation is convenient, it doesn't help the user understand what Herbie is doing, and while Herbie is great at finding clever transformations, it's not very good at making its output simple, digestible, and clear.
With these issues in mind, Alex built a quick prototype of an interactive version of Herbie for a class project. This Herbie Visualizer gave the user access to all of Herbie's rewriting tools, but put them in charge of making decisions like which rewrites to use and which to keep. The Visualizer is now unmaintained, and was never quite polished enough for release, but this post walks through some of its features. You can download a version of the visualizer and play with it yourself.1 [1 Be warned, however: the visualizer uses an old version of Herbie, including fewer supported functions, a different input format, and worse results. Don't use this as your daily driver Herbie. It's also quite rough around the edges.]
A tour of the visualizer
Suppose you are interested in evaluating the expression \(\sqrt{x+1} - \sqrt{x}.\) Of course, you would like to evaluate it on a computer, in floating point, and you are worried about floating-point error. As you should be! This expression is massively inaccurate for \(x > 0\).
Pop it into the visualizer,2 [2 If you downloaded the source code, run
make viz on the command line, and then enter sqrt(x+1) - sqrt(x) in
the input field in the browser that pops up.] and you'll see a screen
something like this:
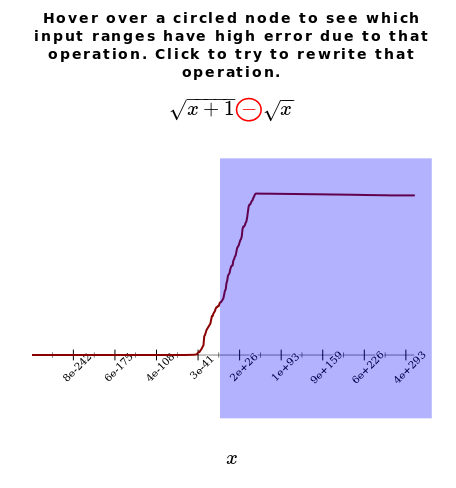
Here, Herbie has analyzed the expression and concluded that the subtraction is an operation responsible for a lot of error in that blue region. In more complicated expressions, there might be multiple operations, each causing error in a different part of the input space. In those cases, the Visualizer gives you the power to choose which operation Herbie should focus on first. When run normally, Herbie chooses the operation to focus on using a numeric ranking called local error.
Once Herbie has an operation to focus on, it comes up with various methods of doing that operation differently:
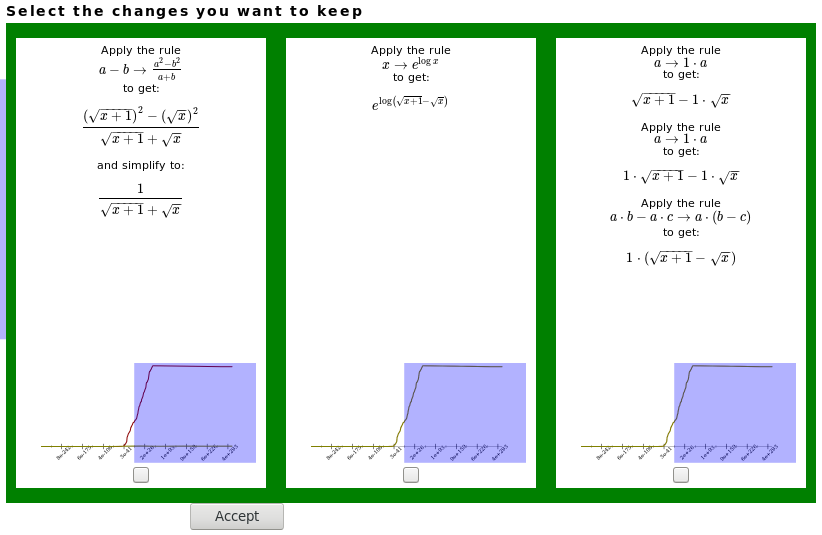
Here, the visualizer presents three different rewrites that Herbie thinks are promising. The first uses a rewrite rule and some algebraic simplification; the second uses a different rewrite rule; and the third chains several rewrite rules together.
The Visualizer gives you the power to decide which of these expressions Herbie should keep, and which it should discard. To help, the little graphs at below each option are supposed to show the error behavior of that example. However, they're a little too small to be useful… When run normally, Herbie uses something like these graphs (and a set-cover solver) to keep around only those rewrites that are useful on at least one input point.
Finally, after some rewrites are discovered and saved, Herbie shows you how accurate its current best program is:
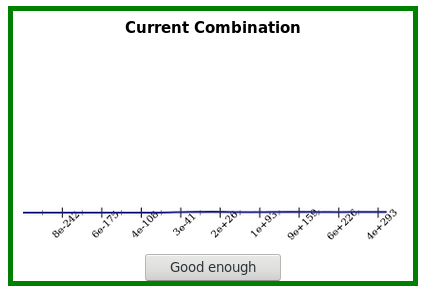
In this case, the current best program is pretty darn accurate, so you can hit the “Good enough” button to exit. But if you're not satisfied, you can also continue rewriting one of the programs Herbie has kept:
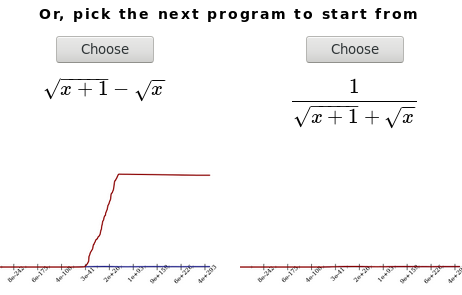
Normally, Herbie chooses the program to start with by taking the one
with the lowest error, and continues taking programs until it stops
coming up with new ones or until it goes around the loop four
times.3 [3 You can change that to a different number with the
--num-iters flag.]
Lessons from the visualizer
Using Herbie through the visualizer is a powerful way to see what Herbie is doing and how it works. Seeing Herbie's frankly insane intermediate expressions also helps takes some of the mystery out of the process. However, it is sometimes unclear how to make the various decisions Herbie asks. For example, it is rarely clear which operator to focus on, and the cost of keeping or not keeping an expression tends to be unclear.
On the other hand, it is difficult to use Herbie's internal process to get much insight into numerical methods. This makes sense, since Herbie also doesn't know much about numerical methods.
A lot of work went into making the visualizer itself useful. For example, every error graph needs to choose what variable to plot along the x-axis, and this choice can be non-trivial. Herbie generally looks at error point-by-point, and doesn't need to do that.
The granularity of steps is important. Herbie actually makes many low-level decisions using various heuristics, and we can't present each one to the user. The visualizer picked a few key places for the user to intervene, which is what makes it usable.
User interface design takes a lot of work. Herbie's web interface is not particularly polished, but the Visualizer is clearly rougher around the edges (as expected for a prototype). In fact, most of the work on Herbie since its initial release has been on UI, not the core algorithms. Yet the UI is clearly more important than the core, since the core is of no use without and interface.
Maintaining interactive components is expensive. The Herbie Visualizer had a lot of hooks into various parts of the Herbie core, and even though Herbie is well designed for interactive use (for debugging) maintaining these hooks was still ultimately not worth it. All of the visualizer code is gone from the latest Herbie. Still, I wish there were time and resources to maintain the Herbie Visualizer. It was a phenomenal tool for teaching Herbie.
As expensive as it is, interactive use is powerful. The latest Herbie release has a “Try it” feature, which lets you run the original and transformed program on inputs of your choosing, and we'd like to add more features like that to Herbie. Interactivity makes it possible for users to pursue their own goals, whether it is accuracy, simplicity, or education and understanding.
Footnotes:
Be warned, however: the visualizer uses an old version of Herbie, including fewer supported functions, a different input format, and worse results. Don't use this as your daily driver Herbie. It's also quite rough around the edges.
If you downloaded the source code, run
make viz on the command line, and then enter sqrt(x+1) - sqrt(x) in
the input field in the browser that pops up.
You can change that to a different number with the
--num-iters flag.